- Joined
- Nov 3, 2024
- Messages
- 109
- Reaction score
- 1
- Points
- 16
Volume Weighted Average Price (VWAP) Indicator for MT5

The VWAP (Volume Weighted Average Price) indicator is a powerful tool for identifying key price levels based on volume-weighted averages. It helps traders identify support and resistance levels, and can provide buy and sell signals based on crossovers of different timeframes (daily, weekly, and monthly).
Key Features of the VWAP Indicator
- Three Key Lines:
- Daily Line (Yellow): Represents the average price for the current day.
- Weekly Line (Red): Represents the average price for the week.
- Monthly Line (Green): Represents the average price for the month.
- Volume-Weighted: Unlike simple moving averages (SMA), the VWAP considers volume, giving more importance to prices where higher trading volumes have occurred.
- Support & Resistance: The VWAP can identify support and resistance levels, helping traders spot potential price reversal or breakout points.
- Crossover Signals: Signals are generated when the weekly and monthly lines cross each other, suggesting potential buy or sell opportunities.
How the VWAP Indicator Works
The VWAP indicator works by calculating an average price adjusted by trading volume, helping traders assess the market's strength and direction. The key element of VWAP is that it provides a better understanding of market sentiment by considering how much volume is traded at certain price levels.- Crossover Signals:
- Bullish Signal: When the weekly line (red) crosses above the monthly line (green), this is a sign that the market could be turning bullish.
- Bearish Signal: When the weekly line (red) crosses below the monthly line (green), this suggests a bearish trend.
- Neutral/Trending Line: The daily line (yellow) acts as a neutral indicator. It can signal both bullish or bearish trends depending on its movement relative to the other lines.
How to Trade with the VWAP Indicator
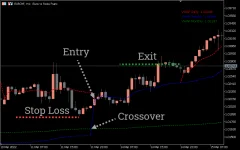
The VWAP indicator is typically used in trend-following strategies, and traders use the crossover of the weekly and monthly lines to confirm potential entries and exits.VWAP Buy Setup:
- Wait for the weekly line (red) to cross above the monthly line (green).
- Ensure the price continues in the direction of the trend.
- Enter the trade either at or after the crossover.
- Stop-Loss: Place a stop-loss near the low of the buying point.
- Exit the trade when the trend reverses (i.e., the crossover signals a change).
VWAP Sell Setup:
- Wait for the weekly line (red) to cross below the monthly line (green).
- Confirm that the price continues to move downward.
- Enter the trade at the crossover or once the trend is established.
- Stop-Loss: Place a stop-loss near the high of the selling point.
- Exit the trade when the trend shifts (crossover indicating reversal).
Conclusion
The VWAP indicator for MT5 is an effective tool for finding precise entry and exit points in the market by using volume-weighted averages. It is particularly useful for identifying support and resistance levels and generating clear buy and sell signals.To further confirm the signals, it is recommended to combine the VWAP with other technical indicators like the RSI or Stochastic oscillators, which can help traders refine their strategies for better performance.


