- Joined
- Nov 3, 2024
- Messages
- 109
- Reaction score
- 1
- Points
- 16
Swing Point Highs and Lows Indicato

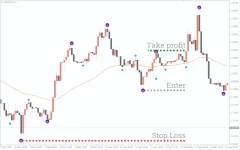
The Swing Point Highs and Lows Indicator for MT4 is a technical analysis tool designed to identify recent market swing highs and lows. It provides traders with clear visual cues to determine optimal entry and exit points, making it suitable for both beginner and experienced traders.
This indicator:
- Displays major and minor swing points with distinct colors and sizes.
- Integrates a moving average (EMA) to act as a trend confirmation filter.
- Marks trend reversals with circles, signaling potential trading opportunities.
Key Features
- Swing Points with Trend Indicators:
- Identifies and plots major and minor swing highs and lows on the chart.
- Major and minor swing points are marked with different colors for easy identification.
- Built-In Moving Average (EMA):
- The EMA acts as a filter, helping traders confirm the validity of swing points.
- Reduces market noise during periods of high volatility.
- Versatility:
- Works on all timeframes and across various currency pairs, commodities, and indices.
- Helps traders adapt to different trading styles (swing, day, or long-term trading).
Trading Strategies with Swing Point Highs and Lows Indicator
1. Buy Strategy (Long Trades)
- Step 1: Identify the most recent swing low circle plotted by the indicator.
- Step 2: Confirm that the trend continues upward (price remains above the EMA).
- Step 3: Enter a long position at the candlestick where the swing low appears or at the next candlestick for a safer entry.
- Step 4: Place a stop-loss just below the recent swing low.
- Step 5: Set a take-profit target near the next swing high.
2. Sell Strategy (Short Trades)
- Step 1: Identify the most recent swing high circle plotted by the indicator.
- Step 2: Confirm that the trend continues downward (price remains below the EMA).
- Step 3: Enter a short position at the candlestick where the swing high appears or at the next candlestick for a safer entry.
- Step 4: Place a stop-loss just above the recent swing high.
- Step 5: Set a take-profit target near the next swing low.
Tips for Using the Indicator
- Combine with Oscillators:
- Use tools like RSI or Stochastic to confirm overbought or oversold conditions, aligning them with swing points for stronger signals.
- Adjust EMA Settings:
- The default 55-period EMA is a solid choice, but you can experiment with different periods based on your trading strategy and timeframe.
- Manage Risk:
- Always place stop-losses based on recent swing points to limit potential losses.
- Avoid Sideways Markets:
- The indicator works best in trending markets. Avoid using it in choppy or range-bound conditions to reduce false signals.
Advantages of the Swing Point Highs and Lows Indicator
- Provides clear and actionable signals for long and short trades.
- Reduces market noise through the use of a moving average filter.
- Works on any timeframe, making it suitable for intraday, swing, and long-term trading.
- Easy to combine with other technical indicators for added confirmation.
Conclusion
The Swing Point Highs and Lows Indicator is a valuable tool for identifying price swings and trend reversals. Its visual cues, combined with the EMA filter, make it highly effective in helping traders find profitable entry and exit points.However, as with any trading indicator, it’s not a standalone solution. To maximize its effectiveness, use it alongside other tools like oscillators or support/resistance analysis. Remember, no indicator guarantees success, so sound risk management is essential.
This indicator is versatile, intuitive, and highly beneficial for traders seeking to enhance their strategies across all market conditions.


