- Joined
- Nov 3, 2024
- Messages
- 109
- Reaction score
- 1
- Points
- 18
Automatic Support and Resistance Indicator for MT5

The Automatic Support & Resistance (SR) Indicator addresses a common limitation of the MetaTrader 5 (MT5) platform by automatically identifying and displaying support and resistance levels on a chart. These levels are pivotal in technical analysis, serving as potential zones for price reversals, breakouts, or consolidations. This tool streamlines the analysis process, making it a valuable addition for both novice and professional traders.
Indicator Features
- Automatic Detection of SR Zones:
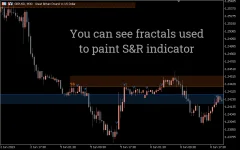
- Resistance zones are marked in red, indicating areas where sellers might dominate as the price approaches.
- Support zones are marked in blue, showing where buyers might step in.
- Time-Saving Tool:
- Automatically identifies and highlights critical price levels, reducing the manual effort needed for analysis.
- Practical Trade Applications:
- Useful for placing stop loss, take profit, and determining entry points.
- Helps identify potential breakouts or bounces from key zones.
- Integrated Fractal Analysis:
- The indicator uses fractals (market extremes) to calculate SR levels.
- Displays the number of fractals used to establish a level for transparency and ease of verification.
- Dynamic Adjustment:
- The height of the SR zones changes dynamically as new fractals form, making the levels adaptive to evolving market conditions.
How the Indicator Works
- Level Construction:
- SR levels are constructed using fractals, with resistance levels based on upper fractals and support levels based on lower fractals.
- The more fractals used to define a level, the stronger the SR zone.
- Height of SR Zones:
- Wider zones indicate greater price variability and market indecision.
- Narrower zones signify tighter price clustering and more defined support or resistance.
- Non-Redrawing Indicator:
- The levels remain consistent, only adjusting their height as new fractals form.
Trading with the Support and Resistance Indicator
Flat Market (Range-Bound Trading)
- Strategy: Trade between the support and resistance zones.
- Buy near the support zone and sell near the resistance zone.
- Flat markets are temporary; prepare for a potential breakout.
Trend Market
- Strategy: Use SR levels to trade in the trend’s direction.
- In an uptrend, look for buy entries near the support zone.
- In a downtrend, consider selling near the resistance zone.
Breakout Trading
- Setup: Monitor SR zones for breakouts.
- A breakout above resistance or below support signals potential strong movement in the breakout direction.
Combining SR Zones with Trendlines
- Integrate trendlines with SR zones for improved accuracy and confidence in trade setups.
Benefits of the Automatic SR Indicator
- Efficiency:
- Saves time by automatically identifying key levels, enabling traders to focus on strategy execution.
- Adaptability:
- Works across all timeframes and currency pairs.
- Suitable for a wide range of trading styles, including scalping, swing trading, and long-term trading.
- Enhanced Decision-Making:
- Identifies strong zones of market activity, helping traders make informed decisions about entries, exits, and stop-loss placements.
- Ease of Use:
- Displays SR zones clearly on the chart without clutter, making it accessible even for beginners.
Conclusion
The Automatic Support & Resistance Indicator for MT5 is an indispensable tool for traders who rely on technical analysis. Its ability to identify critical SR levels dynamically and automatically makes it a time-saving and reliable solution for analyzing price charts. By leveraging these levels in combination with trendlines and other tools, traders can improve their accuracy and increase the probability of successful trades.Whether you're navigating a range-bound market or following a strong trend, this indicator offers insights that align with a variety of trading strategies.


