- Joined
- Nov 3, 2024
- Messages
- 109
- Reaction score
- 1
- Points
- 16
Support Resistance Breakout Arrows Indicator

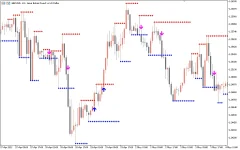
The Support Resistance Breakout Arrows Indicator is a powerful tool for intraday forex traders using breakout strategies. It combines Fractals, CCI, and RSI to generate highly accurate BUY and SELL signals, making it suitable for traders of all experience levels. Additionally, the indicator automatically plots major support and resistance (Sup&Res) levels, allowing traders to manage entries, exits, and position scaling during trending markets.
Key Features of the Indicator
- Signal Arrows for Entry Points:
- BUY Signals: Represented by BLUE arrows.
- SELL Signals: Represented by MAGENTA arrows.
- Support and Resistance Levels:
- Support Levels: Highlighted in BLUE lines.
- Resistance Levels: Highlighted in RED lines.
- Non-Repainting Signals:
- Both the arrows and the Sup&Res levels are static once plotted, providing reliable trading references.
- Customizable Settings:
- Users can adjust CCI and RSI thresholds to filter overbought and oversold conditions, ensuring more precise signals.
- Versatile Application:
- Works on all timeframes, from intraday to long-term (H1, H4, Daily, Weekly).
How It Works
The indicator integrates:- Fractals: To identify local market highs and lows for plotting Sup&Res levels.
- CCI (Commodity Channel Index): To measure market momentum and filter breakout conditions.
- RSI (Relative Strength Index): To confirm overbought or oversold market states, enhancing signal accuracy.
Trading with the Support Resistance Breakout Arrows Indicator
1. Identifying Trade Signals
- BUY Entry:
- Enter a long position when a BLUE arrow appears.
- Consider adding positions at each subsequent BUY signal during a strong trend.
- SELL Entry:
- Enter a short position when a MAGENTA arrow appears.
- Add positions on additional SELL signals during a bearish trend.
2. Using Support and Resistance Levels
- These levels act as dynamic zones for:
- Breakout Trading: Enter trades when price strongly pierces through support or resistance.
- Reversal Trading: Look for rejection or bounce signals at Sup&Res levels to identify reversals.
3. Filtering Signals
- Adjust the CCI and RSI settingsto fine-tune signals. For example:
- CCI levels > +100 may signal an overbought market, reducing the likelihood of further upside.
- RSI levels < 30 can indicate an oversold condition, signaling a potential bottom.
Advantages for Traders
- Beginner-Friendly:
- Automatic Sup&Res plotting eliminates manual errors.
- Easy-to-read arrows simplify decision-making.
- Enhances Trend Trading:
- Multiple signals during a trend allow for position scaling.
- No Repainting:
- Reliable signals and levels ensure traders can plan their strategies without false data.
- Flexible Across Timeframes:
- Suitable for both scalping and swing trading.
Tips for Maximizing the Indicator's Potential
- Combine with Price Action:
- Look for candlestick patterns like pin bars, engulfing patterns, or inside bars near Sup&Res levels for confirmation.
- Use Multiple Timeframes:
- Analyze higher timeframes for trend direction and use lower timeframes for precise entries.
- Incorporate Additional Indicators:
- Pair with tools like moving averages, Fibonacci retracements, or trendline analysis for enhanced reliability.
- Set Realistic Targets:
- Use the next Sup&Res level as your take-profit zone, or apply a risk-reward ratio to determine exits.
Conclusion
The Support Resistance Breakout Arrows Indicator for MT5 is an invaluable tool for automating the identification of Sup&Res levels and generating actionable trading signals. It is particularly effective for intraday traders but is also suitable for swing and position traders. By filtering signals with CCI and RSI and combining them with price action, traders can achieve consistent and profitable results.Moreover, the indicator is free to download and easy to integrate into your MT5 platform, making it an excellent addition to any trader’s toolkit.


