- Joined
- Nov 3, 2024
- Messages
- 109
- Reaction score
- 1
- Points
- 16
Supply and Demand Zones Indicator for MT4: A Comprehensive Guide

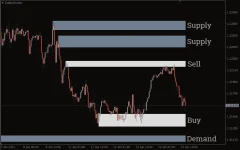
The Supply and Demand Zones Indicator is a powerful tool for forex traders, automatically identifying crucial market levels where price is likely to react. These zones represent areas of significant supply (resistance) and demand (support), providing insights into potential trade setups. The indicator simplifies trading by accurately marking these zones on the chart, eliminating the need for manual plotting.

The Supply and Demand Zones Indicator is a powerful tool for forex traders, automatically identifying crucial market levels where price is likely to react. These zones represent areas of significant supply (resistance) and demand (support), providing insights into potential trade setups. The indicator simplifies trading by accurately marking these zones on the chart, eliminating the need for manual plotting.
Key Features of the Supply and Demand Zones Indicator
- Automatic Zone Identification:
- White Zones: Indicate areas that have been tested or retouched recently, making them more reliable.
- Grey Zones: Represent untouched areas, which can be monitored for future price reactions.
- Customization Options:
- Allows traders to tweak settings for additional features like displaying Fibonacci retracements between zones.
- Real-Time Application:
- The indicator updates dynamically, ensuring traders always have the most relevant zones displayed.
How to Use the Supply and Demand Zones Indicator
- Understanding the Zones:
- Supply Zones: Price drops sharply from these areas, reflecting strong selling interest. These zones act as resistance.
- Demand Zones: Price rises sharply from these areas, indicating robust buying interest. These zones act as support.
- Trading Strategy:
- Sell at Supply Zones: When the price hits a supply zone, anticipate a reversal to the downside.
- Buy at Demand Zones: When the price touches a demand zone, look for a reversal to the upside.
- Prioritize white zones, as these have been tested multiple times and are more reliable.
- Confirming Trades:
- Use additional tools like candlestick patterns, moving averages, or momentum indicators to validate entry and exit points.
Who Can Benefit From This Indicator?
- Beginner Traders:
- Ideal for those struggling to identify support and resistance levels manually.
- Experienced Traders:
- Provides accurate and automated zone plotting, saving time and enhancing precision.
Key Insights About Supply and Demand Zones
- Zone Construction:
- Demand Zones: Created by sharp upward movements, signaling strong buying interest.
- Supply Zones: Formed by significant downward moves, reflecting selling pressure.
- Types of Zones:
- Fresh Zones: Untouched and often more robust, as unfilled orders remain.
- Tested Zones: Previously visited but still relevant; reliability may weaken over time.
- Differences from Support and Resistance Levels:
- Supply and Demand Zones: Cover broader areas and account for market volume and activity.
- Support and Resistance Levels: Represent specific price points based on historical data.
Pros and Cons of the Indicator
Pros:- Precision: Highlights reliable zones for entry and exit points.
- Longevity: Zones remain relevant even after years of market activity.
- Ease of Use: Automated plotting simplifies analysis.
- Broad Zones: Can make precise timing challenging.
- Reliance on Additional Tools: Requires confirmation with other indicators for optimal results.


