- Joined
- Nov 3, 2024
- Messages
- 109
- Reaction score
- 1
- Points
- 16
Super Trend Indicator for MT4

The Super Trend Indicator is a simple yet effective non-repainting MT4 trend-following tool. It uses a single trendline curve to identify market trends and reversal points, making it especially popular among traders looking for straightforward, actionable signals.
How the Super Trend Indicator Works
- Trend Calculation:
- The indicator calculates its trendline based on the Nbr period (lookback period) and multipliers (volatility factor).
- The trendline shifts and changes color based on price position relative to the indicator.
- Color Coding for Trends:
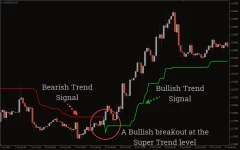
- Green Line: Indicates a bullish (uptrend) market. The trendline serves as support, and price above the line confirms the trend.
- Red Line: Signals a bearish (downtrend) market. The trendline acts as resistance, and price below the line confirms the downtrend.
- Horizontal Trendline:
- If the indicator plots a horizontal line, it indicates a sideways (consolidating) market. This happens when the price fails to break the high or low of the previous candle and forms inside bars.
Using the Super Trend Indicator for Trading
Identifying Trend Reversals:
- A change in the indicator color signals a trend reversal:
- Green to Red: A bearish trend begins.
- Red to Green: A bullish trend starts.
Trading Rules:
- Buy Entry (Bullish Trend):
- Wait for the price to break above the green trendline.
- Enter a BUY trade when the trendline turns green.
- Place a stop-loss below the trendline.
- Exit when the trendline turns red or the price breaks below it.
- Sell Entry (Bearish Trend):
- Wait for the price to break below the red trendline.
- Enter a SELL trade when the trendline turns red.
- Place a stop-loss above the trendline.
- Exit when the trendline turns green or the price breaks above it.
- Trading Sideways Markets:
- Wait for a breakout above or below the horizontal trendline.
- Enter a trade in the direction of the breakout (e.g., BUY for an upward breakout, SELL for a downward breakout).
Stop-Loss and Trailing Stops:
- Use the Super Trend line as your initial stop-loss and for trailing stops as the trade progresses.
- Adjust your stop-loss level to follow the trendline for maximizing profits while minimizing risk.
Advantages of the Super Trend Indicator
- Non-Repainting:
- The signals do not change once the candle closes, ensuring reliability.
- Simplicity:
- Easy-to-use rules make it suitable for both beginners and experienced traders.
- Versatility:
- Effective for intraday, day trading, and swing trading.
- Works well with forex, stocks, and other financial instruments.
- Trend Confirmation:
- Provides clear signals with minimal ambiguity, reducing guesswork.
Limitations of the Super Trend Indicator
- False Signals in Sideways Markets:
- The indicator performs poorly during low-volatility, range-bound markets.
- Lagging Signals:
- As with most trend-following indicators, the Super Trend may lag in identifying trend reversals.
- Needs Confirmation:
- Best used in conjunction with other technical tools (e.g., RSI, MACD) for filtering false breakouts.
Conclusion
The Super Trend Indicator for MT4 is a powerful yet simple tool for identifying trends and trend reversals. It is particularly useful for intraday and day traders seeking straightforward buy/sell signals. While it excels in trending markets, traders should combine it with other indicators or strategies to confirm signals and navigate sideways market conditions effectively.This indicator can enhance trend-following strategies and is an excellent addition to any trader’s toolkit, regardless of experience level.


