- Joined
- Nov 3, 2024
- Messages
- 109
- Reaction score
- 1
- Points
- 18
SSL Channel Chart Alert Indicator

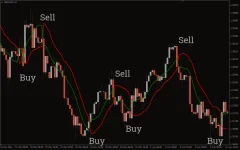
The SSL Channel Chart Alert Indicator is an MT4 tool that combines moving averages to generate BUY and SELL signals based on trend changes. The term SSL stands for Semaphore Signal Level, and the indicator provides visual signals to help traders identify bullish and bearish market conditions. It’s particularly useful for trend-following traders who rely on the crossover of indicator lines to make trading decisions.
Key Features of the SSL Channel Chart Alert Indicator
- Trend Detection: The indicator generates clear bullish and bearish signals using two lines (typically green for bullish and red for bearish).
- No Repainting: The signals generated by the indicator do not repaint, making it a reliable tool for identifying trend changes.
- Easy to Interpret: The crossover of the indicator lines (green above red for a buy signal, red above green for a sell signal) is simple and easy to follow.
- Alerts: The indicator provides alerts when a crossover happens, allowing traders to act immediately.
- Multi-timeframe Support: It works across all timeframes, from intraday charts to long-term timeframes like daily, weekly, and monthly charts.
- Free and Easy Installation: The indicator is free to download and install.
How the SSL Channel Chart Alert Indicator Works
- Bullish Signal (Buy): A buy signal is generated when the green line crosses above the red line, indicating an uptrend. This suggests that the market is bullish and the trader can enter a buy position.
- Stop Loss: The recommended stop loss for this position is placed at the previous swing low.
- Profit Target: The profit target is typically placed at the next trading signal or when a good risk-reward ratio is achieved.
- Bearish Signal (Sell): A sell signal occurs when the green line crosses below the red line, indicating a downtrend. Traders can enter a sell position.
- Stop Loss: The stop loss for this trade is usually placed at the previous swing high.
- Profit Target: Similar to the buy trade, the profit target is based on the next trading signal or a suitable risk-reward ratio.
How to Use the SSL Channel Chart Alert Indicator Effectively
- Intraday Timeframes: For shorter timeframes like H1 or M15, the indicator can generate frequent signals, which might not always indicate a valid trend. Traders need to filter these signals by considering the broader market context, such as using higher timeframes for trend confirmation.
- Long-Term Timeframes: On longer timeframes like daily, weekly, or monthly charts, the signals tend to be less frequent but more reliable. The bigger trends can be identified on higher timeframes, and the lower timeframes can be used to spot optimal entry points.
- Multi-Timeframe (MTF) Analysis: For best results, traders can use a multi-timeframe approach. Identify the overall trend on higher timeframes, then fine-tune entries on lower timeframes for precise trade execution.
- Support and Resistance Levels: Traders should also consider support and resistance zones near the entry point, as well as any trendline channels. These levels can act as additional confirmation or barriers to the trade’s success.


