- Joined
- Nov 3, 2024
- Messages
- 109
- Reaction score
- 1
- Points
- 16
Shved Supply & Demand Indicator for MT4

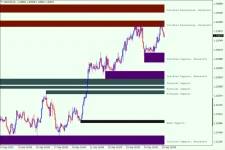
The Shved Supply & Demand Indicator is a valuable tool for Forex traders seeking to identify zones where key shifts in the buyer-seller ratio occur. These zones represent supply and demand levels, where heightened market activity has historically taken place. By using this indicator, traders can identify potentially profitable entry points and refine their strategies.
1. Description of the Shved Supply & Demand Indicator
Supply and demand zones are areas on the price chart where significant trading activity has previously occurred. These levels are crucial because:- They often spark strong price movements.
- Repeated price interaction with these zones offers opportunities to identify profitable trade entries.
- High activity zones are visually larger, reflecting their significance.
- Zones are labeled with short text descriptions for clarity.
2. Types of Zones Highlighted by the Indicator
The Shved Supply & Demand Indicator plots five types of zones:- Weak Zones
- Areas with minimal supply or demand.
- These zones should be traded cautiously or avoided altogether.
- Untested Zones
- Zones where a single strong price movement originated.
- These levels represent potential entry points for future trades.
- Verified Zones
- Zones tested multiple times, sparking renewed interest in trading.
- The number of retests is displayed on the chart, with higher retests indicating stronger zones.
- Proven Zones
- Zones tested repeatedly and associated with consistent trading activity.
- These levels are often the basis for significant market moves or trend reversals.
- Turncoat Zones
- Former resistance or support zones that have flipped roles.
- These levels result from shifts in supply and demand dynamics and are useful for trading in the new direction.
3. How to Use the Shved Supply & Demand Indicator
The indicator can be used in two primary ways:1. Trading During a Trend Change
- Example: Transition from a downtrend to an uptrend.
- First Wave: A strong upward price movement creates an Untested Zone.
- Second Wave: A subsequent bullish wave confirms the zone, upgrading it to a Verified Zone.
- Third Wave: A new high is formed, signaling the zone’s potential, now classified as a Proven Zone.
- Trade Entry: Look for BUY opportunities when the price re-enters the Proven Zone.
- Stop Loss: Place a stop-loss order below the zone.
2. Trading with the Main Trend
- Example: A downtrend with retracement waves.
- Retracement: A brief upward move within the downtrend.
- First Sell Wave: A significant drop below the prior low signals seller strength, marking a Verified Zone.
- Second Sell Wave: Confirming the trend, offering a SELL entry point at market price.
- Stop Loss: Place a stop-loss order above the Verified Zone.
Enhancing the Indicator’s Signals
While the Shved Supply & Demand Indicator highlights critical levels, combining it with additional tools and strategies can improve its accuracy:- Indicators: Moving averages, oscillators, or trend indicators can complement supply and demand zones.
- Price Action: Use candlestick patterns or chart formations for confirmation.
Conclusion
The Shved Supply & Demand Indicator is a powerful addition to any trader's toolkit, providing reliable insights into market activity zones. By integrating this indicator into broader trading systems, traders can increase their likelihood of success. Whether trading trends or reversals, the plotted levels offer high-probability zones for entries and exits.This indicator is not just a standalone tool—it’s a versatile complement that adapts to any trading approach, enhancing accuracy and profitability.


