- Joined
- Nov 3, 2024
- Messages
- 109
- Reaction score
- 1
- Points
- 18
RSI Divergence Indicator

The RSI Divergence Indicator combines the classic Relative Strength Index (RSI) with divergence signals to help traders identify potential trend reversals. It addresses the issue of false signals and the indicator's inability to always reach the overbought and oversold levels, which can limit its effectiveness.
What is RSI Divergence?
RSI (Relative Strength Index) is a momentum oscillator that measures the speed and change of price movements. It ranges from 0 to 100:- Below 30: Indicates an oversold market (potential for upward reversal).
- Above 70: Indicates an overbought market (potential for downward reversal).
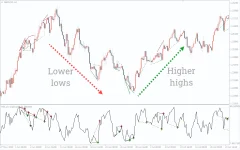
- Bullish Divergence: Occurs when the price makes lower lows but the RSI forms higher lows. This suggests that despite the price moving lower, momentum is weakening, indicating a potential reversal to the upside.
- Bearish Divergence: Occurs when the price makes higher highs but the RSI forms lower highs. This suggests that despite the price moving higher, momentum is weakening, indicating a potential reversal to the downside.
How to Use the RSI Divergence Indicator
- Identify Divergence: Look for discrepancies between the price movement and the RSI:
- Bullish Divergence: Price forms lower lows, while RSI forms higher lows, signaling potential buying opportunities.
- Bearish Divergence: Price forms higher highs, while RSI forms lower highs, signaling potential selling opportunities.
- Buy Signals (Bullish Divergence):
- Look for the RSI to be oversold (below 30), followed by a higher low on the RSI, while the price continues to make lower lows.
- Once the divergence is confirmed, enter a buy position. A confirmation candle (like a bullish engulfing or a close above resistance) can also be used for added confidence.
- Stop-Loss: Place it near the recent low to manage risk.
- Exit: Exit when the RSI starts to turn down or shows signs of reversing.
- Sell Signals (Bearish Divergence):
- Look for the RSI to be overbought (above 70), followed by a lower high on the RSI, while the price continues to make higher highs.
- Once the divergence is confirmed, enter a sell position. You may also wait for a confirmation candle (such as a bearish engulfing or a close below support) for extra validation.
- Stop-Loss: Place it near the recent high.
- Exit: Exit when the RSI starts to climb up or shows signs of reversal.
Advantages of RSI Divergence Indicator
- More Reliable Signals: The RSI Divergence Indicator helps filter out false signals that can occur with the standard RSI by adding the divergence analysis.
- Reversal Identification: It’s especially useful for spotting when a trend is losing momentum and a reversal might be imminent, helping you catch moves early.
Conclusion
The RSI Divergence Indicator is a valuable tool for traders looking to enhance the reliability of the RSI by detecting divergences, which often indicate potential market reversals. By combining RSI with divergence signals, traders can make more informed decisions, potentially improving entry and exit points for trades.It’s a great way to identify areas where price action and momentum are misaligned, signaling opportunities to trade on potential reversals. However, like any tool, it should be used in conjunction with other indicators or analysis techniques to confirm trade setups and manage risk effectively.


