- Joined
- Nov 3, 2024
- Messages
- 109
- Reaction score
- 1
- Points
- 18
QQE Indicator (Qualitative Quantitative Estimation)

The QQE (Qualitative Quantitative Estimation) indicator is an enhanced version of the RSI (Relative Strength Index), using a smoothing technique to reduce noise and provide more accurate signals. It is known for its effectiveness in detecting trends and volatility shifts, especially after significant market events like the 2008 financial crisis. The QQE is prized for its lack of lag and ability to rarely produce false signals, making it a valuable tool for traders.
Key Features of the QQE Indicator
- Trend Detection:
- The QQE indicator helps determine market trends, particularly by assessing whether the market is in an uptrend or downtrend.
- Above 50: Bullish trend (uptrend), where traders should look for buy opportunities.
- Below 50: Bearish trend (downtrend), where traders should look for sell opportunities.
- Overbought and Oversold Conditions:
- The QQE can be used to identify overbought and oversold conditions in the market.
- Overbought (>70): Signals a strong market and suggests buy opportunities.
- Oversold (<30): Indicates a market that may be primed for a short position.
- Divergence Detection:
- Bullish Divergence: Occurs when the QQE sets higher lows while the price sets lower lows, signaling an impending bullish reversal.
- Bearish Divergence: Occurs when the QQE sets lower highs while the price sets higher highs, suggesting a potential bearish reversal.
- Momentum Shifts:
- The QQE uses two lines: a bold line (representing smoothed RSI) and a trailing line.
- Bullish Signal: When the bold line crosses above the trailing line, indicating the start of an upward momentum.
- Bearish Signal: When the bold line crosses below the trailing line, indicating the start of a downward momentum.
How to Use the QQE Indicator in Trading
Trend Trading
- Above 50: Focus on buying, as the market is in an uptrend.
- Below 50: Focus on selling, as the market is in a downtrend.
Overbought and Oversold Conditions
- Above 70: Consider entering a long position, as it signals a strong market.
- Below 30: Consider entering a short position, as the market is oversold.
Divergence
- Bullish Divergence: Look for long trades when QQE shows higher lows but the price is setting lower lows.
- Bearish Divergence: Look for short trades when QQE shows lower highs but the price is setting higher highs.
Momentum Reversal
- Bullish Momentum: Enter long trades when the bold line crosses above the trailing line.
- Bearish Momentum: Enter short trades when the bold line crosses below the trailing line.
Trading Example
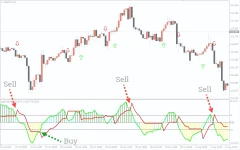
In the EUR/USD daily chart example, the QQE indicator clearly tracks price movement:- The green line (smoothed RSI) rises with upward price movements and falls with downward price movements, showing little lag.
- When the price reaches overbought or oversold levels, the QQE provides clear signals.
- A buy signal is generated when the green line crosses above the red line, and a sell signal occurs when the green line crosses below the red line. These crossings often mark the start of a strong price trend.
Conclusion
The QQE Indicator is one of the most reliable tools for detecting market trends and potential reversals. By incorporating this indicator into your trading strategy, you can better identify optimal entry points and avoid trading during unfavorable market conditions. It’s particularly useful for trend traders, reversal traders, and those looking to enter positions with strong momentum.Overall, QQE is a versatile and accurate indicator that can help traders pinpoint high-probability setups with minimal lag and false signals.


