- Joined
- Nov 3, 2024
- Messages
- 109
- Reaction score
- 1
- Points
- 18
Pivot Indicator for MT5

The Pivot Indicator is a powerful tool for identifying key support and resistance levels, making it invaluable for both beginner and experienced traders. By calculating pivot points and other levels based on the previous trading session, this indicator offers objective insights into potential price reversals, aiding traders in decision-making.
How the Pivot Indicator Works
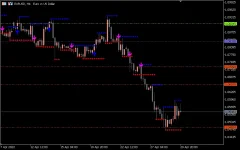
The Pivot Indicator plots seven horizontal levels on the chart, derived from the previous trading session's high, low, close, and optionally open prices. These levels serve as potential support and resistance zones where price action may reverse or break out.- Pivot Point (PP): The central level, calculated as the average of the high, low, and close:
PP=(High+Low+Close)3PP = \frac{(High + Low + Close)}{3}PP=3(High+Low+Close) - Resistance Levels (R1, R2, R3):
- R1: (2×PP)−Low(2 \times PP) - Low(2×PP)−Low
- R2: PP+(High−Low)PP + (High - Low)PP+(High−Low)
- R3: High+2×(PP−Low)High + 2 \times (PP - Low)High+2×(PP−Low)
- Support Levels (S1, S2, S3):
- S1: (2×PP)−High(2 \times PP) - High(2×PP)−High
- S2: PP−(High−Low)PP - (High - Low)PP−(High−Low)
- S3: Low−2×(High−PP)Low - 2 \times (High - PP)Low−2×(High−PP)
- Intermediate Levels: These are midpoints between the pivot point and support/resistance zones, providing additional insights.
How to Use the Pivot Indicator
1. Range Trading
The Pivot Indicator is ideal for range traders, helping identify reversal zones to open buy or sell positions:- Buy Trades:
- Look for reversals at S1, S2, or S3, indicating strong support.
- Sell Trades:
- Look for reversals at R1, R2, or R3, indicating strong resistance.
2. Breakout Trading
The Pivot Indicator also benefits breakout traders by highlighting critical zones:- Bullish Breakout:
- A price breakout above R1, R2, or R3 signals strong buying momentum. Place buy orders after confirmation of the breakout.
- Bearish Breakout:
- A price breakout below S1, S2, or S3 signals strong selling pressure. Place sell orders after confirmation of the breakdown.
3. Stop Loss and Take Profit Placement
- Use support levels (S1, S2, S3) and resistance levels (R1, R2, R3) as natural take profit and stop-loss levels.
- Combine with candlestick patterns (e.g., pin bars, engulfing patterns) for better confirmation of entries and exits.
Advantages of the Pivot Indicator
- Objective Calculation:
- Unlike subjective tools, pivot levels are calculated using a fixed formula, ensuring consistency.
- Simplicity:
- Easy to understand and use for traders of all experience levels.
- Short-Term Trading Focus:
- Particularly effective for day traders and scalpers, as it identifies key intraday levels.
- Multiple Applications:
- Useful for both range trading and breakout strategies.
Limitations
- No Standalone Signal:
- The Pivot Indicator does not generate direct buy or sell signals. It works best when combined with other indicators or price action analysis.
- Ineffectiveness in Low Volatility:
- In choppy or sideways markets, the levels may not provide clear direction.
Combining with Other Indicators
For improved accuracy, use the Pivot Indicator alongside:- RSI (Relative Strength Index): To confirm overbought or oversold conditions.
- MACD (Moving Average Convergence Divergence): To gauge momentum and trend strength.
- Candlestick Patterns: For stronger entry and exit confirmations.
Conclusion
The Pivot Indicator for MT5 is a versatile tool for identifying critical price levels, helping traders place effective entries, exits, and stop-loss orders. Whether you’re a range or breakout trader, this indicator provides objective, actionable insights. For best results, use it in conjunction with complementary tools like RSI, MACD, or trendlines, and always confirm signals with candlestick patterns.4o


