- Joined
- Nov 3, 2024
- Messages
- 109
- Reaction score
- 1
- Points
- 16
The New VWAP Indicator

The New VWAP (Volume-Weighted Average Price) indicator calculates the average price of a currency pair based on its weighted volume. The VWAP helps traders determine potential support and resistance levels, making it a valuable tool for identifying trade opportunities.
Key Features:
- Three Lines Representation: The indicator displays three distinct lines representing daily, weekly, and monthly periods. These lines analyze the overall market volume and distribute it according to its weight.
- Comparison to Other Indicators: While similar in appearance to Moving Averages or Bollinger Bands, the VWAP differs by focusing specifically on weighted volume rather than just price movements.
- Weighted Volume Focus: By calculating average prices based on volume, the indicator identifies areas of support and resistance, providing clear entry and exit points.
How to Use the New VWAP Indicator in Trading
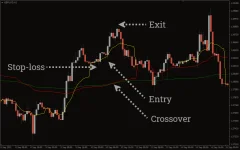
The indicator’s ability to emphasize weighted volume through average price calculation allows traders to identify critical support and resistance levels. These levels help in determining optimal entry and exit points.Signal Generation:
- Weekly and Monthly Line Crossover:
- Bullish Signal: When the red weekly line crosses above the green monthly line, it signals a potential upward trend.
- Bearish Signal: When the red weekly line crosses below the green monthly line, it signals a possible downward trend.
- Daily Neutral Line: The yellow daily line represents a neutral trend and adjusts its movement based on the prevailing trend direction:
- In an uptrend, the yellow line moves higher.
- In a downtrend, it moves lower.
Trading Setups
Buy Setup:
- Wait for the red line to cross above the green line.
- Confirm that the price continues to move upward.
- Enter a buy trade during or after the crossover.
- Place a stop-loss near the most recent low.
- Exit the trade when the trend reverses.
Sell Setup:
- Wait for the red line to cross below the green line.
- Confirm that the price continues to move downward.
- Enter a sell trade during or after the crossover.
- Place a stop-loss near the most recent high.
- Exit the trade when the trend reverses.


