- Joined
- Nov 3, 2024
- Messages
- 109
- Reaction score
- 1
- Points
- 16
Market Sessions Indicator

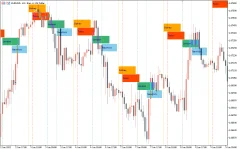
The Market Sessions Indicator for MetaTrader 5 is a useful tool that displays the trading sessions of the day with horizontal lines on the price chart. This indicator highlights the opening prices, the high and low points of the previous trading session, and shows the future trading sessions. It helps traders independently identify bullish or bearish trends during different market sessions, enabling them to make more informed buy or sell decisions.
Features of the Market Sessions Indicator
- Session Display:The indicator shows the four main forex trading sessions with horizontal lines:
- Tokyo: Orange Red
- Sydney: Orange
- London: Sea Green
- New York: Sky Blue
- Session Timing: The indicator helps traders visualize each session's start and end, allowing them to recognize key price movements and session-related trends.
- Previous Session High/Low: It displays the high and low of the previous session, which can be used to gauge price action and anticipate market behavior for the current session.
- Future Sessions: It also marks future market sessions, giving traders a preview of upcoming volatility and price movements.
How to Use the Market Sessions Indicator
- Determine Market Trends:
- Bullish Continuation: If the price breaks the high of the previous session, it could signal a bullish trend continuation. Traders may enter a buy position, setting a stop loss below the previous session's low and aiming for a good risk/reward ratio.
- Bearish Continuation: If the price breaks the low of the previous session, it may indicate a bearish trend continuation. Traders can enter a sell position, setting a stop loss above the previous session's high and targeting profits with a favorable risk/reward ratio.
- Trading During Specific Sessions:
- The indicator is particularly useful for traders who prefer to trade during specific market sessions. For example:
- Tokyo Session: Traders can look for volatility after the Tokyo market opens, typically characterized by lower volatility.
- London and New York Sessions: These sessions often experience higher volatility and can offer significant trading opportunities.
- The indicator is particularly useful for traders who prefer to trade during specific market sessions. For example:
- Session Analysis Across Timeframes:
- The Market Sessions Indicator can be applied to various timeframes, though it works best on timeframes like M15 (15 minutes) or H1 (1 hour). On higher timeframes, the session lines might overlap, so traders can disable some of the session lines for clarity.
Chart Example
On the EUR/USD H1 chart, the Market Sessions Indicator displays:- Tokyo Session in Orange Red.
- Sydney Session in Orange.
- London Session in Sea Green.
- New York Session in Sky Blue.


