- Joined
- Nov 3, 2024
- Messages
- 109
- Reaction score
- 1
- Points
- 18
MACD 4C Indicator for Metatrader 4

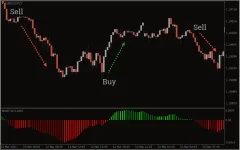
The MACD 4C Indicator is an upgraded version of the traditional MACD (Moving Average Convergence and Divergence) indicator, widely regarded as a staple in forex trading. This enhanced indicator provides a color-coded histogram that makes it easier to analyze trend strength and anticipate potential trend changes.
Features of the MACD 4C Indicator
- Color-Coded Histogram:
- Unlike the traditional MACD histogram (single color), the MACD 4C uses four colorsto represent the strength and direction of the trend:
- Above the Zero Line:
- Green: Strong bullish momentum.
- Lime: Weakening bullish momentum.
- Below the Zero Line:
- Red: Strong bearish momentum.
- Maroon: Weakening bearish momentum.
- Above the Zero Line:
- Unlike the traditional MACD histogram (single color), the MACD 4C uses four colorsto represent the strength and direction of the trend:
- Ease of Use:
- The color-coded system simplifies the identification of trend strength, making it especially useful for new traders.
- Divergence and Convergence:
- The MACD 4C excels at identifying divergences (when price and the indicator move in opposite directions) and convergences (when price and the indicator align).
- These phenomena signal potential momentum shifts or trend reversals.
- Platform Compatibility:
- Designed for Metatrader 4 (MT4) and available as a free download.
- Suitability:
- Useful for all traders, from beginners to experienced professionals.
- Works across various timeframes and currency pairs.
How to Use the MACD 4C Indicator
1. Trend Analysis
- Green and Lime (Above Zero Line):
- Indicates bullish momentum.
- Strong (Green) suggests a robust uptrend, while weakening (Lime) signals potential slowdown.
- Red and Maroon (Below Zero Line):
- Indicates bearish momentum.
- Strong (Red) suggests a solid downtrend, while weakening (Maroon) signals a potential trend shift.
2. Identifying Divergence and Convergence
- Divergence:
- Occurs when the MACD histogram and price move in opposite directions.
- Example: Price makes a higher high, but the histogram shows a lower high (bearish divergence), signaling a potential reversal.
- Convergence:
- Occurs when the MACD histogram and price align after divergence, confirming momentum.
3. Combining with Other Indicators
- To enhance accuracy, use the MACD 4C alongside other indicators like:
- RSI: For overbought/oversold conditions.
- Stochastic Oscillator: To refine entry and exit points.
- Trendlines: To confirm directional bias.
Trading Example: EUR/USD M15
- Bullish Setup:
- The MACD histogram rises above the zero line and turns Green, indicating strong bullish momentum.
- Enter a buy trade at this point.
- Bearish Setup:
- The histogram falls below the zero line and turns Red, indicating strong bearish momentum.
- Enter a sell trade at this point.
- Divergence Example:
- Bearish Divergence: Price makes a higher high, but the MACD histogram makes a lower high.
- Signal: Prepare for a possible trend reversal and enter a sell trade after confirmation.
Advantages of the MACD 4C Indicator
- Visual Clarity:
- The color-coded histogram makes it easier to assess trend strength and direction at a glance.
- Convergence/Divergence Detection:
- Helps traders identify potential reversals with precision.
- Wide Applicability:
- Suitable for multiple trading strategies, including trend-following and reversal trading.
- Beginner-Friendly:
- Intuitive design and ease of use make it an excellent tool for new traders.
- Free to Download:
- Accessible without additional costs, making it ideal for traders on a budget.
Limitations
- Lagging Nature:
- Like all MACD-based indicators, it is a lagging indicator and may not react swiftly to sudden price changes.
- Reliance on Confirmation:
- Should not be used in isolation. Always confirm signals with other indicators or price action.
- Challenging in Sideways Markets:
- Performance may decline in highly volatile or range-bound markets.
Conclusion
The MACD 4C Indicator is a powerful tool for forex traders seeking a visual and intuitive method to analyze market trends and identify potential reversals. Its color-coded histogram simplifies trend assessment, making it suitable for both beginners and experienced traders.To maximize its effectiveness:
- Use the MACD 4C in conjunction with other technical indicators (e.g., RSI, Stochastic, Fibonacci).
- Confirm all signals with market structure or candlestick patterns.


