- Joined
- Nov 3, 2024
- Messages
- 109
- Reaction score
- 1
- Points
- 16
MACD2Line Indicator for MT4:

Many standard MT4 indicators aren't always effective for analyzing the dynamic Forex market, especially with the increase in market participants and the widespread use of trading algorithms. The MACD2Line indicator is a free custom upgrade to the standard MT4 MACD oscillator, with added features to help traders better identify market trends and reversals.
When the moving averages are positioned far above the zero line, it signals a possible downward reversal; when the averages are below the zero line, an upward reversal may be more likely.
The MACD2Line is categorized as an oscillator, making it ideal for spotting trend changes. Regardless of your trading style—swing, intraday, or long-term—the indicator can serve as a valuable addition. Swing and intraday traders using shorter EMA periods will see more entry opportunities, while long-term traders using longer periods may see fewer, but potentially more reliable, signals.
For example, in a Sell setup:

Many standard MT4 indicators aren't always effective for analyzing the dynamic Forex market, especially with the increase in market participants and the widespread use of trading algorithms. The MACD2Line indicator is a free custom upgrade to the standard MT4 MACD oscillator, with added features to help traders better identify market trends and reversals.
Contents
- Description
- Features
- Trading Signals (Alerts)
- Settings
1. Description of MACD2Line
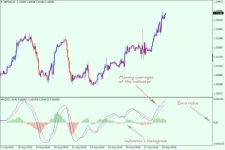
The MACD2Line indicator displays two moving averages (Exponential Moving Average, or EMA) along with a volume histogram in a separate chart window. This indicator has a zero line, marking the boundary between overbought (above the line) and oversold (below the line) zones.When the moving averages are positioned far above the zero line, it signals a possible downward reversal; when the averages are below the zero line, an upward reversal may be more likely.
The MACD2Line is categorized as an oscillator, making it ideal for spotting trend changes. Regardless of your trading style—swing, intraday, or long-term—the indicator can serve as a valuable addition. Swing and intraday traders using shorter EMA periods will see more entry opportunities, while long-term traders using longer periods may see fewer, but potentially more reliable, signals.
2. Features of MACD2Line
MT4 includes a basic MACD indicator, but the MACD2Line offers several enhancements:- Two Moving Averages: The MACD2Line displays two EMAs—fast (blue) and slow (red). Entry signals are generated when the fast line crosses the slow line.
- Colored Volume Histogram: The histogram has two colors—red for bearish volume and green for bullish volume. A red histogram suggests focusing on Sell trades, while a green histogram suggests focusing on Buy trades.
- Enhanced Zero Line Signal: The zero line in MACD2Line provides an additional, stronger signal compared to the standard MACD, making it more effective for trend identification.
3. Trading Signals (Alerts)
The MACD2Line provides bearish and bullish signals, but it’s recommended to use a trendline for confirmation. The AutoTrendLines indicator, which can be used in combination, helps improve signal accuracy.For example, in a Sell setup:
- The EMA is in the overbought zone, the histogram is red, and the fast EMA crosses the slow EMA, forming a Sell signal.
- A downtrend line further supports the bearish signal. As long as the trendline remains unbroken, traders should only consider Sell positions.
- A stop-loss can be set above the trendline, with the position closed when the EMA indicates maximum oversold conditions.
- An uptrend line confirms bullish conditions, which are represented by a green histogram, bullish trendlines, and a crossover of the moving averages.
- A stop-loss can be placed below the trendline, and the trade closed when the EMA approaches maximum overbought readings.


