- Joined
- Nov 2, 2024
- Messages
- 144
- Reaction score
- 5
- Points
- 18
Lucky Reversal MT4 Indicator: A Guide to Trend Reversals and Trading Strategies

Trend reversals are a common occurrence in forex trading, and tools like the Lucky Reversal Indicator on MT4 help traders catch these shifts with ease. With unique features and a focus on confirmed trend changes, the Lucky Reversal Indicator is designed to identify the transition points in trends, making it an essential tool for traders who want to capitalize on emerging trends.


Trend reversals are a common occurrence in forex trading, and tools like the Lucky Reversal Indicator on MT4 help traders catch these shifts with ease. With unique features and a focus on confirmed trend changes, the Lucky Reversal Indicator is designed to identify the transition points in trends, making it an essential tool for traders who want to capitalize on emerging trends.
What is the Lucky Reversal Indicator?
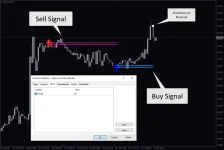
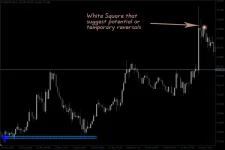
The Lucky Reversal Indicator signals trend reversals using blue and red arrows, with wavy lines that follow each trend direction. A blue arrow signals the beginning of an uptrend, while a red arrow marks the start of a downtrend. Additionally, a white square may appear, indicating a potential or temporary reversal.Strengths and Limitations
The Lucky Reversal Indicator is a lagging indicator, meaning it confirms reversals after they have begun, which minimizes the risk of false signals but may cause you to miss the earliest part of a trend shift. However, this lag makes it a powerful confirmation tool for trends already underway.How to Use the Lucky Reversal Indicator

- Apply the Lucky Reversal Indicator along with two Moving Averages (MAs) on the chart: one set to default and the other to a 20-period.
- For an uptrend: enter a buy when the fast MA crosses above the slow MA after a blue arrow appears.
- For a downtrend: enter a sell when the fast MA crosses below the slow MA after a red arrow appears.
- The key is to trade in the direction confirmed by both the Lucky Reversal Indicator and the MA crossover.
- A white square on the chart signals a potential reversal. Enter your trade when the square changes into an uptrend (blue arrow) or downtrend (red arrow) signal.
- Set take-profit targets and stop losses, ensuring not to risk more than 2% of your capital per trade.
- The wavy line provides a visual stop-loss guide, as price rarely crosses back over the line once it’s drawn.
FAQs
- Who is the Lucky Reversal Indicator best suited for?
- It’s ideal for intermediate to professional traders familiar with lagging indicators. Beginners can use it, but with caution.
- Best time frames?
- Higher time frames like H1, H4, and D1 tend to offer more reliable signals. While it can be used on lower time frames, the lagging nature may be more noticeable.
- Can it be used alone?
- Although possible, combining it with other tools like Moving Averages or RSI is recommended for better accuracy.
- Meaning of the white square?
- This marks a potential or temporary reversal. When it turns into a blue or red arrow, the reversal is confirmed.
- What if market movement contradicts the indicator?
- Have a solid risk management plan, set stop losses, and be prepared to exit if the market shifts unexpectedly.


