- Joined
- Nov 3, 2024
- Messages
- 109
- Reaction score
- 1
- Points
- 16
ICT Asian Range Indicator

The ICT Asian Range Indicator is designed for traders using the ICT trading strategy, particularly those focused on trading breakouts during the Asian market session. The ICT strategy is based on the observation that the forex market tends to consolidate during the Asian session, and after this consolidation, significant price movement typically occurs, especially during the London and New York trading sessions. The ICT Asian Range Indicator helps traders identify these consolidation phases and enter trades when price breaks out of the range.
Key Features of the ICT Asian Range Indicator
- Automatic Range Detection: The indicator automatically identifies the range formed during the Asian session and draws colored boxes around this range on the chart.
- Breakout Trading: Traders use these boxes to spot breakout opportunities. A breakout occurs when the price moves outside of the established range, signaling potential trading opportunities in the direction of the breakout.
- Timeframe Suitability: The indicator works best on shorter timeframessuch as:
- 1-hour (H1)
- 15 minutes (M15)
- 5 minutes (M5)
- Currency Pair Suitability:While the indicator can be used with various forex pairs, it is most effective for those involving the Japanese yen, including:
- USD/JPY
- EUR/JPY
- GBP/JPY
- GBP/USD
- EUR/USD
How the ICT Asian Range Indicator Works
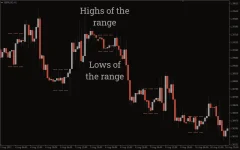
- Range Box Creation: The indicator draws a box around the price action that occurs during the Asian session, marking the high and low of the range.
- Breakout Strategy:The primary trading strategy is to enter a trade when the price breaks outside of this box:
- Bullish Signal (Buy): A bullish breakout occurs when the price breaks above the upper line of the range. Traders can enter a buy position once the breakout is confirmed.
- Bearish Signal (Sell): A bearish breakout occurs when the price breaks below the lower line of the range. Traders can enter a sell position once the breakout is confirmed.
Trading Example
Consider the GBP/USD chart:- During the Asian session, the price consolidates, forming a range (marked by the colored box).
- If the price breaks above the upper range line, this is a bullish breakout, signaling a potential buying opportunity.
- Conversely, if the price breaks below the lower range line, it signals a bearish breakout, indicating a possible selling opportunity.
Best Practices for Using the ICT Asian Range Indicator
- Combine with Other Strategies: While the ICT Asian Range Indicator is a powerful tool for breakout trading, it works best when combined with other strategies, such as the retest strategy. In this approach, traders wait for the price to retest the range breakout before entering a trade.
- Risk Management: Since breakout trading can lead to false breakouts, it's crucial to manage risk by using stop-loss orders and considering other technical indicators to confirm the breakout.


