- Joined
- Nov 3, 2024
- Messages
- 109
- Reaction score
- 1
- Points
- 16
Fibonacci Retracement Indicator for MT4

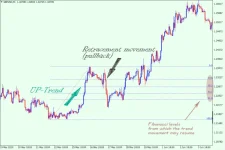
The Fibonacci Retracement Indicator for MT4 is a valuable tool that simplifies the identification of retracement levels during trends. It automatically plots Fibonacci levels on the chart, filtering out flat market phases and focusing on active price movements. This indicator helps traders spot potential pivot points where the prevailing trend is likely to resume.
1. Description of the Fibonacci Retracement Indicator
This indicator is designed to:- Automatically draw Fibonacci levels on the chart.
- Identify retracement (pullback) depths relative to the primary trend.
- Highlight pivot points from which the trend may resume.
2. Fibonacci Levels Description
The indicator uses the following Fibonacci levels, expressed as percentages:- 100%: The starting point for Fibonacci placement.
- 61.8% ("Golden Ratio"): A critical level where pivot points often form. It complements the 50% level.
- 50.0%: A common area for pivots, especially as short-term traders close positions after pullbacks.
- 38.2%: Indicates strong trader confidence; pivots frequently occur here during active trends.
- 23.6%: Rarely a pivot point, as traders typically wait for deeper retracements.
- 0%: The ending point for Fibonacci placement.
Factors to Consider:
- Strong Primary Trend + Weak Pullback: Higher probability of trend resumption.
- Weak Primary Trend + Strong Pullback: Indicates a possible trend reversal.
- Confluence with Round Numbers or Other Tools: Increases the reliability of the Fibonacci levels as pivot zones.
3. How to Use the Fibonacci Retracement Indicator
The Fibonacci Retracement indicator is most effective when used alongside other tools, such as trendlines or support/resistance levels. Here’s how to maximize its utility:Using the Indicator with a Downtrend
- Example:
- The pullback wave ends near 61.8% and 50.0% levels.
- This convergence suggests a potential pivot point, signaling a SELL opportunity.
- Use a trendline as a secondary indicator to confirm the downtrend.
- Stop Loss: Place above the trendline for safety.
Using the Indicator with an Uptrend
- Example:
- A pullback reaches the 38.2% level, indicating trader optimism and strong BUY sentiment.
- Open a trade at the market price.
- Stop Loss: Place below the support line.
Adjusting Across Timeframes
- When switching timeframes, you may need to reapply the indicator to ensure the levels align with the new interval.
Advantages of the Fibonacci Retracement Indicator
- Broad Applicability:
- Suitable for scalping, intraday, and long-term trading strategies.
- Identifies Market Sentiment:
- By analyzing retracement levels, traders can gauge market optimism or pessimism.
- Consistent Levels:
- Provides reliable pivot zones regardless of timeframe or trading style.


