- Joined
- Nov 3, 2024
- Messages
- 109
- Reaction score
- 1
- Points
- 18
Exponential Moving Average (EMA) Indicator for MT4

The Exponential Moving Average (EMA) is a popular tool in forex trading, valued for its ability to react quickly to price changes. Unlike the Simple Moving Average (SMA), the EMA gives more weight to recent price movements, making it more responsive to current trends. This feature makes the EMA particularly useful for traders looking to identify trends and early reversal signals.
How the EMA Works
- Bullish and Bearish Signals:
- A rising EMA indicates a bullish trend, suggesting potential buy opportunities.
- A falling EMA signals a bearish trend, indicating potential sell opportunities.
- Price Position Relative to EMA:
- If the price is above the EMA, the market is likely in an uptrend.
- If the price is below the EMA, the market is likely in a downtrend.
Trading Strategies with EMA
1. Crossover Strategy
The crossover strategy uses two EMAs with different periods, commonly referred to as the fast EMA (shorter period) and slow EMA (longer period), such as 9-period and 21-period EMAs.- Buy Signal:
- The fast EMA crosses above the slow EMA from below.
- Sell Signal:
- The fast EMA crosses below the slow EMA from above.
- Exit Strategy:
- Place a stop loss near the recent low for buy trades or the recent high for sell trades.
- Set the take-profit level at the next resistance (for buy trades) or support zone (for sell trades).
2. Triple EMA Strategy
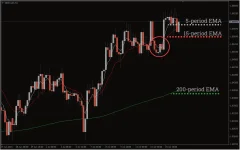
The triple EMA strategy uses three EMAs of varying lengths, such as 5, 15, and 200 periods.- Buy Signal:
- The price is trading above the 200-period EMA.
- The 5-period EMA crosses above the 15-period EMA.
- Sell Signal:
- The price is trading below the 200-period EMA.
- The 5-period EMA crosses below the 15-period EMA.
- Exit Strategy:
- Place a stop loss near the most recent low or the 200-period EMA.
- Use a 1:3 risk-to-reward ratio or set the take-profit level at the next resistance/support level.
Chart Example
On a chart of GBP/AUD:- EMA Periods:
- 5-period EMA: Blue Line.
- 15-period EMA: Red Line.
- 200-period EMA: Green Line.
- Trade Example:
- The price is above the 200-period EMA, signaling an uptrend.
- A buy signal occurs when the 5-period EMA crosses above the 15-period EMA (yellow circle).
- The stop loss is placed just below the recent low or below the 200-period EMA.
- The trade exits at the next resistance zone, ensuring a favorable risk-to-reward ratio.
Advantages of EMA
- Responsive to Price Changes:
- Quickly adapts to new market conditions, providing timely signals.
- Versatility:
- Suitable for various timeframes and trading styles, including scalping, day trading, and swing trading.
- Trend Confirmation:
- Helps identify and confirm market trends.
Limitations of EMA
- Shorter EMA Periods:
- Highly sensitive and prone to false signals in choppy markets.
- Longer EMA Periods:
- Smoother trends but slower to react, which may lead to missed opportunities.
- Requires Additional Tools:
- Best used in conjunction with other indicators or price action analysis for confirmation.


