- Joined
- Nov 2, 2024
- Messages
- 144
- Reaction score
- 5
- Points
- 18
Buy Sell Magic Indicator for MT4: A Simple Guide to Clear Buy and Sell Signals

The Buy Sell Magic Indicator is a popular tool on MetaTrader 4 (MT4) that simplifies Forex trading with straightforward buy and sell signals. Combining three indicators and a custom price action filter, it’s designed to provide clear entry and exit points without the clutter of bands, histograms, or lines. Ideal for both new and experienced traders, this indicator is available for free download.


The Buy Sell Magic Indicator is a popular tool on MetaTrader 4 (MT4) that simplifies Forex trading with straightforward buy and sell signals. Combining three indicators and a custom price action filter, it’s designed to provide clear entry and exit points without the clutter of bands, histograms, or lines. Ideal for both new and experienced traders, this indicator is available for free download.
How the Buy Sell Magic Indicator Works
This indicator generates non-repainting arrows to signal buy and sell opportunities, making it highly user-friendly. It works best on lower time frames (M1, M5, M15, M30) during the London and New York sessions, when the market is more active and volatile. It is effective for all currency pairs but is not recommended during holidays or major economic news events.Trading with the Buy Sell Magic Indicator
1. Buy Signal
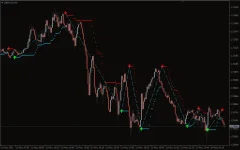
- A green arrow signals a potential long (buy) position, along with a real-time pop-up alert for easy identification.
- Stop Loss: The indicator calculates a stop loss automatically, or you can set it just below the dotted grey line on the chart.
- Take Profit: You can set your target using a 3:1 reward-to-risk ratio or wait for a red (sell) signal to exit.
2. Sell Signal
- A red arrow signals a short (sell) position, along with a pop-up alert displaying a suggested sell stop.
- Stop Loss: You can set it just above the dotted red line.
- Take Profit: Exit when a green (buy) signal appears, or set a custom profit target.
Example Scenario
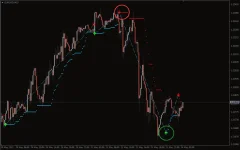
In the chart example:
- A red arrow at 1.2236 suggests a sell entry point with a stop loss at the red dotted line.
- A green arrow at 1.2165 signals a buy entry, with the blue dotted line as a suitable stop loss.


