- Joined
- Nov 3, 2024
- Messages
- 109
- Reaction score
- 1
- Points
- 16
Breakout Indicator

The Breakout Indicator for MetaTrader 5 is a specialized tool designed to help traders identify key support and resistance levels in the market. These levels are essential for breakout trading, a strategy that seeks to profit from significant price movements when the price breaks out of a defined range. This indicator automates the process of spotting breakout opportunities, making it especially useful for both beginners and experienced traders.
Key Features of the Breakout Indicator
- Automatic Support and Resistance Zones:
- The Breakout Indicator automatically detects significant support and resistance zones on the chart, eliminating the need for manual drawing.
- These zones are marked as areas where price is likely to experience a breakout or reversal.
- Optimal Timeframe:
- The indicator works best on timeframes less than 4 hours and is most effective on the H1 (1-hour) timeframe. It does not draw levels on higher timeframes.
- Trading Style Compatibility:
- This indicator is versatile and can be used for various trading styles, including scalping, day trading, and intraday trading.
- User-Friendly for Beginners:
- For beginners, the Breakout Indicator simplifies the process of identifying crucial levels. It provides clear breakout points without requiring deep technical analysis skills.
How to Trade with the Breakout Indicator
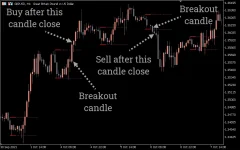
There are two primary ways to use the Breakout Indicator to identify high-probability BUY and SELL signals:1. Trend Following Approach:
- Study the general trend of the market (uptrend or downtrend).
- Wait for the price to break out of the support or resistance zone, confirming the breakout direction.
- Enter a BUY position if the price breaks above resistance or a SELL position if the price breaks below support.
2. Rejection Candle Approach (High Probability Setup):
- Wait until the price breaks out of the identified support or resistance zone and then closes outside the zone.
- Wait for the next candle to retest the breakout level and show a rejection signal, such as a long wick. This signals that the breakout is valid and the price is likely to continue in the breakout direction.
- Enter the market after the rejection candle ends, trading in the direction of the breakout.
Advantages of Using the Breakout Indicator
- No Need for Manual Support/Resistance Identification:
- The indicator automatically identifies support and resistance levels, saving traders time and reducing the risk of missing important breakout zones.
- Works Well for Beginners:
- Beginners can use the Breakout Indicator to easily spot potential breakout points without having to manually analyze price charts.
- Effective on Multiple Timeframes:
- The indicator is suitable for scalping, day trading, and intraday trading strategies, making it a versatile tool for a wide range of traders.
- High Probability Signals:
- By using the rejection candle approach, traders can identify breakout points with higher probability, increasing the chances of a successful trade.


