- Joined
- Nov 3, 2024
- Messages
- 109
- Reaction score
- 1
- Points
- 16
Better Volume 1.5 Indicator for MT4

The Better Volume 1.5 indicator is a powerful tool designed for Forex traders who wish to assess market sentiment and volume activity to make better trading decisions. By analyzing trading volumes, it helps traders gauge the potential behavior of other market participants, helping to identify optimal entry or exit points. This indicator is particularly useful in volatile market conditions, where trading volumes can provide valuable insights into future price movements.
1.
The Better Volume 1.5 indicator uses tick volumes, which represent the total number of price changes during a specific time interval, as opposed to actual transaction volumes, to measure market activity. This approach is especially relevant in Forex markets, where the actual number of trades or lots isn't directly available. The indicator displays this volume data in a histogram, allowing traders to analyze how active the market is at any given time.2.
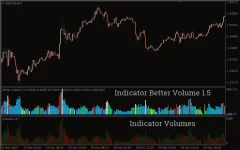
Key Differences from Standard MT4 Volumes Indicator:- Volume Categorization: While the standard MT4 volumes indicator only shows the rise and fall of tick volumes, Better Volume 1.5 takes it further by categorizing volumes into distinct colors, helping traders better interpret the market’s activity.
- Moving Average: A moving average is plotted over the volume histogram, providing an additional trading signal when the moving average crosses volume bars. This can help traders identify trends or reversals.
- Blue Volumes: Indicate standard trading activity.
- Yellow Volumes: Signal low trading volumes, suggesting market indecision or uncertainty—best to avoid trading in such periods.
- Green Volumes: Indicate increased trader interest. This could signify repositioning by major players, which may make price direction unclear, so it’s best to stay cautious.
- Red Volumes: Signal increased buying activity or demand, pointing to potential buying opportunities.
- White Volumes: Indicate increased selling activity, suggesting potential selling opportunities.
3.
Buy Strategy:- When the green volumes increase, it signals more buyer interest in the market. However, be cautious as it could mean repositioning by larger participants, making direction unclear.
- Look for buy entry points when the market shows an increase in red volumes (boost in customer activity).
- Place your stop loss below the trend line, and exit when the indicator signals a sell (white volumes).
- Similarly, white volumes (increased selling activity) can indicate a potential sell entry point.
- As with the buy strategy, place your stop loss above the trend line and exit when the indicator signals buy volumes (green or blue).
- Always consider the overall market trend and sentiment. Higher volumes (red/white) during trends can provide strong trading signals, but low volumes (yellow) should be avoided as they signal uncertainty.
- Trend line analysis: Use trend lines to enhance the reliability of the signals and improve the chances of success.
4.
The Better Volume 1.5 indicator offers easy-to-understand settings that allow customization for traders’ preferences. You can adjust the display, color-coding, and volume filters to suit your trading strategy and needs.Conclusion: Why Use Better Volume 1.5?
The Better Volume 1.5 indicator is essential for traders who want to incorporate volume analysis into their strategies. By categorizing and color-coding tick volumes, it provides a clearer view of market activity, helping traders make informed decisions. This indicator is especially useful for spotting potential buy and sell signals, understanding market sentiment, and avoiding trading during periods of low activity or uncertainty.Incorporating the Better Volume 1.5 indicator into your trading toolkit can significantly enhance your ability to predict market movements and make profitable trades.


