- Joined
- Nov 3, 2024
- Messages
- 109
- Reaction score
- 1
- Points
- 16
Automatic Trendlines Indicator for MT4

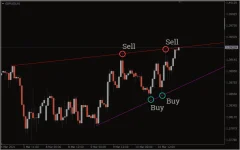
The Automatic Trendlines Indicator for MT4 is an advanced tool designed to automatically draw trendlines on the chart. Trendlines are critical in many forex trading strategies since they represent support and resistance levels. However, drawing them manually can be time-consuming and subjective. This indicator uses Widner’s oscillator to automate the process, saving traders time and ensuring that the trendlines are drawn based on real-time market data.
Key Features
- Automated Trendline Drawing:
- The Automatic Trendlines Indicator automatically draws trendlines by identifying support and resistance levels based on market data.
- The indicator uses Widner’s oscillator to construct trendlines, ensuring they are reliable and dynamic as market conditions change.
- It also deletes redundant trendlines, ensuring the chart remains clean and uncluttered.
- Future Projections:
- The indicator doesn't just draw past trendlines; it also projects them into the future, marking potential support and resistance zones where price could react in the coming periods.
- This helps traders anticipate market movements and identify potential reversal points.
- Breakout and Bounce-Back Strategies:
- The indicator is ideal for traders who use trendline breakouts or trendline failure (bounce-back) strategies.
- When the price breaks above an uptrend line, traders can enter buy positions, while a break below a downtrend line signals a sell position.
- Conversely, when the price fails to break a trendline (a bounce-back), it shows weakness in the trend, signaling a buy or sell opportunity based on the direction of the trend.
- User-Friendly for New Traders:
- For beginners, the indicator is an excellent tool to learn about trendlines and support/resistance levels.
- New traders can observe how trendlines are drawn and use them to build their own trading strategies.
- The indicator helps to simplify the technical analysis process by providing clear visual signals of where the market may reverse or continue trending.
- Free to Download:
- The Automatic Trendlines Indicator for MT4 is free to download, making it easily accessible to both novice and experienced traders.
- It is also easy to install and set up on the MT4 platform, allowing traders to focus more on analysis and trading.
How to Use the Automatic Trendlines Indicator
- Download and Install:
- Install the Automatic Trendlines Indicator on your MT4 platform. Once installed, the indicator will start automatically drawing trendlines on your charts.
- Understand Trendline Breakout Strategy:
- Uptrend Breakout: If the price breaks above an uptrend line, this signals strength, and a buy order should be placed. Set your stop loss below the previous low or the broken trendline.
- Downtrend Breakout: A break below a downtrend line signals a weakening trend, so traders should place a sell order with a stop loss above the last high or the trendline.
- Apply Trendline Failure Strategy:
- Bounce-back (Failure to Break): If the price fails to break the trendline, it signals a possible reversal.
- Downtrend Line Failure: If price doesn't break the downtrend line, consider a buy position with a stop loss below the trendline.
- Uptrend Line Failure: If price fails to break above the uptrend line, a sell order should be placed with a stop loss above the previous high.
- Bounce-back (Failure to Break): If the price fails to break the trendline, it signals a possible reversal.
- Combine with Price Action:
- To increase the reliability of your trading decisions, combine the Automatic Trendlines with other price action signals. For example, use candlestick patterns or chart formations to confirm the trendline signals.
- Multi-Timeframe Analysis:
- You can also use the indicator for multi-timeframe analysis by comparing the trendlines drawn on different timeframes to spot the strongest support/resistance levels.
Conclusion
The Automatic Trendlines Indicator for MT4 is an essential tool for any trader who relies on trendlines, support, and resistance for making trading decisions. It simplifies the process of identifying important price levels and projecting future trends, making it a valuable tool for both new and experienced traders.- Key Benefits:
- Automatically draws and projects trendlines, saving traders time and effort.
- Helps anticipate market reversals and support/resistance levels.
- Ideal for trendline breakout and failure strategies.
- Free to download and easy to use for beginners, as well as a useful reference for experienced traders.
- Best For:
- New traders looking to learn how to draw trendlines and understand support/resistance.
- Experienced traders who want a reliable, automated trendline tool to supplement their trading strategies.
4o mini


