- Joined
- Nov 3, 2024
- Messages
- 109
- Reaction score
- 1
- Points
- 16
AutoTrendLine Indicator

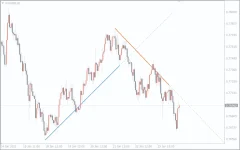
The AutoTrendLine indicator automatically displays the most relevant trend lines on the chart, focusing only on those lines that the price is likely to interact with. Built on a mathematical function and filters, it simplifies chart analysis by showing only the most critical trend lines.
This indicator adjusts quickly to the market. If new price extremes occur, the trend line’s slope changes accordingly. If a trend reverses or becomes flat, outdated lines are removed, ensuring only valid lines remain on the chart.
With simplicity and efficiency, the AutoTrendLine indicator is a useful tool for both beginners and experienced traders, providing a clear overview of the market situation.
The more signals that confirm an entry, the stronger and more reliable the trade is likely to be. For example, if price growth near a downtrend line slows, a transient level signal—where the level has previously been used for buying but now shows selling activity—can confirm a Sell signal. In such cases, a Stop Loss should be placed beyond the trend line, with the trade closing upon hitting the Take Profit or when the trend changes.
This setup can offer a favorable risk-to-reward ratio, often around 1:3.
Using the trend line and a transient level offers a strong Buy entry point in this scenario. A Stop Loss should be set below the trend line, with the trade closed when a Take Profit level is reached or if a trend reversal signal, such as a Double Top pattern, appears.
This Buy example also provides a risk-to-reward ratio of 1:3.

The AutoTrendLine indicator automatically displays the most relevant trend lines on the chart, focusing only on those lines that the price is likely to interact with. Built on a mathematical function and filters, it simplifies chart analysis by showing only the most critical trend lines.
This indicator adjusts quickly to the market. If new price extremes occur, the trend line’s slope changes accordingly. If a trend reverses or becomes flat, outdated lines are removed, ensuring only valid lines remain on the chart.
How the AutoTrendLine Indicator Works
The AutoTrendLine indicator displays two main trend lines:- Blue Solid Line: Indicates the current uptrend.
- Blue Dotted Line: Represents a projected uptrend.
- Red Solid Line: Shows the current downtrend.
- Red Dotted Line: Marks a projected downtrend.
Importance of Trend Lines in Forex Trading
Forex prices are influenced by various factors, many of which can be difficult to interpret, such as market reactions to news. During high volatility, trend lines can break, leading to challenging analysis. However, the AutoTrendLine adjusts to genuine breakouts and trend reversals, making it easier to analyze price movements and forecast potential changes.With simplicity and efficiency, the AutoTrendLine indicator is a useful tool for both beginners and experienced traders, providing a clear overview of the market situation.
How to Trade Using the AutoTrendLine Indicator
Trend-following is widely regarded as a profitable and low-risk strategy. This indicator allows traders to identify trend-based entry points and assess the overall market direction.The more signals that confirm an entry, the stronger and more reliable the trade is likely to be. For example, if price growth near a downtrend line slows, a transient level signal—where the level has previously been used for buying but now shows selling activity—can confirm a Sell signal. In such cases, a Stop Loss should be placed beyond the trend line, with the trade closing upon hitting the Take Profit or when the trend changes.
This setup can offer a favorable risk-to-reward ratio, often around 1:3.
Example of Trading an Uptrend with AutoTrendLines
When trading an uptrend, the indicator plays a significant role by maintaining key trend lines, even through potential false breakouts. Without the AutoTrendLine, traders might manually adjust their trend lines and misinterpret the chart.Using the trend line and a transient level offers a strong Buy entry point in this scenario. A Stop Loss should be set below the trend line, with the trade closed when a Take Profit level is reached or if a trend reversal signal, such as a Double Top pattern, appears.
This Buy example also provides a risk-to-reward ratio of 1:3.


