- Joined
- Nov 3, 2024
- Messages
- 109
- Reaction score
- 1
- Points
- 16
Auto TrendLine Indicator: Simplifying Trend Line Analysis

Trend lines are a cornerstone of technical analysis, used to identify price trends and potential reversal points. However, manually drawing and interpreting trend lines can be challenging due to factors such as:
- Frequent redrawing of trend lines.
- Difficulty distinguishing between false and true breakouts.
- The possibility of cluttered charts with too many lines.
Features of the Auto TrendLine Indicator
- Automatic Plotting:
- Displays only the most valid trend lines.
- Uses mathematical functions and filters to identify significant support and resistance levels.
- Dynamic Adjustment:
- Adjusts trend lines based on market conditions.
- Removes invalid lines when trends reverse or become flat.
- Updates angles as new price extremes form.
- Clear Visual Representation:
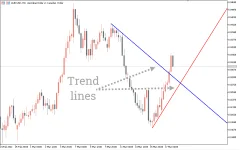
- Red Line: Indicates the support trend line.
- Blue Line: Represents the resistance trend line.
- Simplifies chart reading, making it easier to analyze trends and price movements.
- Adaptability to Market Events:
- Accounts for price volatility during events such as news releases.
- Updates only in response to true breakouts or trend reversals, reducing noise.
Why Trend Lines Matter
Trend lines help traders:- Understand the current market direction.
- Identify potential areas of support and resistance.
- Make more informed trading decisions.
- Filtering out insignificant lines to reduce chart clutter.
- Highlighting only those lines with a high likelihood of influencing price action.
How to Use the Auto TrendLine Indicator in Trading
Trend Following
- Identify Direction: Use the blue and red lines to determine whether the trend is bullish or bearish.
- Entry Points: Look for price action near the trend lines for potential entry points.
Trading with Confirmation
- Combine the trend lines with other tools (e.g., candlestick patterns or momentum indicators) for more reliable signals.
- The more signals supporting a trade decision, the higher the likelihood of success.
Example
- If the price slows near the uptrend line (blue line) and additional indicators suggest selling, this could indicate a high-probability short trade.
- Stop Loss: Place beyond the trend line to safeguard against unexpected reversals.
- Take Profit: Use pending orders or close the trade when the trend changes.
Advantages of the Auto TrendLine Indicator
- Simplified Analysis:
- Reduces the complexity of manual trend line drawing.
- Dynamic Updates:
- Automatically adapts to new market conditions.
- User-Friendly:
- Suitable for both novice and experienced traders.
- Versatile Application:
- Can be used across different timeframes and trading styles.
Limitations and Recommendations
While the Auto TrendLine Indicator is a powerful tool, it should be used as part of a broader trading system:- Do Not Rely Solely on the Indicator: No indicator is foolproof. Combine it with other analysis methods.
- Market Context: Consider economic news and fundamental factors that may impact price trends.
- Practice and Backtesting: Test the indicator on demo accounts before using it in live trading.
Conclusion
The Auto TrendLine Indicator simplifies trend line analysis by automatically identifying and adjusting significant support and resistance levels. It reduces the subjectivity and errors associated with manual trend line drawing, making it a valuable tool for traders of all experience levels.However, like any indicator, it works best when combined with other tools and strategies. By integrating the Auto TrendLine Indicator into your trading approach, you can enhance your ability to spot key trend lines and make informed trading decisions.


