- Joined
- Nov 3, 2024
- Messages
- 109
- Reaction score
- 1
- Points
- 16
Auto TrendLine Indicator

Trend lines are a cornerstone of classical technical analysis, widely used by traders of all levels. They are simple to draw and highly effective. However, traders often face challenges with trend lines, such as frequent redrawing, distinguishing between true and false breakouts, or dealing with an overwhelming number of potential lines based on market extremes. The Auto TrendLine Indicator is designed to address these issues, offering a streamlined approach to identifying valid trend lines.
What is the Auto TrendLine Indicator?
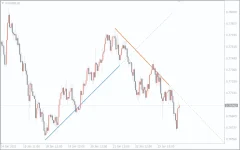
The Auto TrendLine indicator automatically identifies and displays the most significant trend lines on your chart. These are the lines that the price is most likely to interact with, providing a focused and accurate analysis.The indicator uses mathematical functions and filters to highlight the most important lines, minimizing noise and confusion. It adapts quickly to market movements:
- When the price forms new extremes, the trend line adjusts its slope.
- If the trend reverses or the market enters a flat phase, outdated trend lines are removed.
- Current Trend Lines
- Blue solid line: Current uptrend.
- Red solid line: Current downtrend.
- Projected Trend Lines
- Blue dotted line: Projected uptrend.
- Red dotted line: Projected downtrend.
Why Are Trend Lines Important?
Trend lines are essential for understanding market behavior. They reflect the collective sentiment of traders and provide valuable insights into price movement. However, interpreting trend lines can be challenging, especially during events like news releases, which can cause increased volatility and false breakouts.The Auto TrendLine Indicator accounts for such scenarios by dynamically adjusting to true breakouts and trend changes. This makes chart analysis more straightforward and reliable, benefiting both beginner and experienced traders.
How to Trade with the Auto TrendLine Indicator
Trading with the trend is widely regarded as one of the safest and most profitable strategies, as it aligns with the majority of market participants. The Auto TrendLine Indicator helps you:- Analyze charts comprehensively.
- Identify exact entry points for trades.
- Increase the reliability of signals by combining trend lines with other technical levels.
Example: Selling During a Downtrend
In a scenario where the price growth slows near a downtrend line:- The Auto TrendLine Indicator identifies a potential selling opportunity.
- An additional signal, such as a transient level, confirms the selling interest.
- Place a Stop Loss beyond the trend line.
- Exit the trade using a Take Profit order or during a trend change.
Example: Buying During an Uptrend
For an uptrend scenario:- The indicator maintains the previous downtrend line despite what appears to be a false breakout, avoiding unnecessary chart adjustments.
- A combination of the trend line and a transient level signals a strong buy opportunity.
- Set a Stop Loss beyond the trend line.
- Exit the trade with a Take Profit order or when a trend reversal occurs (e.g., indicated by a double top pattern).
Conclusion
The Auto TrendLine Indicator simplifies the process of identifying and analyzing trend lines, combining efficiency with ease of use. While no indicator can guarantee success, this tool provides traders with a clearer understanding of key market movements and potential trade setups.By dynamically adjusting to market conditions and filtering out less significant lines, the Auto TrendLine Indicator can help traders:
- Reduce errors caused by false breakouts.
- Focus on high-probability trade opportunities.
- Complement their existing trading strategies.


