- Joined
- Nov 3, 2024
- Messages
- 109
- Reaction score
- 1
- Points
- 18
Auto Support & Resistance Indicator
The Auto Support & Resistance Indicator solves a notable gap in the default MT4 terminal, which lacks a tool for automatically plotting support and resistance levels. These levels are critical elements of technical analysis, widely used by traders to identify potential price reaction zones.
What Does the Auto Support & Resistance Indicator Do?
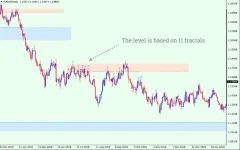
This indicator automatically identifies and plots significant support and resistance levels directly on the chart:- Resistance zones are marked in red, representing potential areas of selling interest as the price approaches.
- Support zones are marked in blue, highlighting possible areas of buying interest.
However, manual drawing of these levels is still recommended for beginners, as it builds essential skills and a deeper understanding of price behavior. In such cases, the indicator’s levels can serve as examples and a helpful guide.
Additionally, the displayed levels can act as references for setting stop-loss and take-profit orders, while also serving as signals for entering trades.
How Does the Indicator Work?
The Auto Support & Resistance Indicator determines levels using market extrema or fractals, which are peak or trough points on the chart. Unlike the standard MT4 Fractals Indicator, this tool uses these extrema to calculate and plot meaningful support and resistance zones.- Resistance levels are built based on the concentration of multiple fractals near the same price range.
- The heightof each level depends on the distance between the highest and lowest fractals within that zone:
- Wider distance = Higher level.
- Narrower distance = Lower level.
How to Trade with the Auto Support & Resistance Indicator
The primary trading strategies involving support and resistance zones revolve around:- Breakout Trading – Entering trades when the price breaks through a level.
- Rebound Trading – Trading based on the price bouncing off a level.
Flat Market Trading
In a flat (sideways) market, trading between the upper resistance and lower support zones can be a straightforward and profitable strategy. However, flats are temporary in the Forex market, and trends will eventually emerge.For example:
- A small flat zone forms between support and resistance.
- If the preceding trend was bullish, there’s a higher probability of an upward breakout.
Trading in a Trending Market
During active trends, support and resistance zones provide excellent entry points for trades aligned with the primary trend direction.To increase accuracy, combine support and resistance zones with trend lines. For instance:
- Use the AutoTrendLines Indicator to confirm the trend.
- Look for confluence between the trend line and resistance/support zones.
Example: Trading a Downtrend
- A downtrend line aligns with a resistance zone.
- This confluence increases the reliability of sell signals.
- Traders can consider selling opportunities both intraday and for longer-term positions.
Why Use the Auto Support & Resistance Indicator?
The indicator offers several advantages:- Time-Saving: Automatically plots accurate zones, reducing manual effort.
- High Efficiency: Adjusts dynamically to market conditions without redrawing.
- Versatility: Works for both trending and flat market conditions.
Conclusion
The Auto Support & Resistance Indicator is a valuable addition to any trader's toolkit. It simplifies the process of identifying critical price zones, offering both accuracy and efficiency. Whether used as a standalone tool or integrated into a broader trading strategy, it can help traders better understand market dynamics and make more informed trading decisions.For best results, use the indicator alongside other analysis tools and adapt its signals to your trading system.


