- Joined
- Nov 3, 2024
- Messages
- 109
- Reaction score
- 1
- Points
- 16
Auto Fibonacci Retracement Indicator for MT4

The Auto Fibonacci Retracement indicator for MT4 is an essential tool for traders who leverage Fibonacci levels in their technical analysis. It eliminates the manual task of identifying highs and lows on price charts, which can be time-consuming and prone to errors. This indicator automatically plots the Fibonacci retracement levels, enabling traders to focus on strategy rather than setup.
The indicator works across all timeframes and currency pairs, making it versatile for a variety of trading styles and strategies.
How the Auto Fibonacci Retracement Indicator Works
The Auto Fibonacci Retracement indicator plots retracement levels between 0% and 100%:- In a bearish market, the 0% level is at the top and the 100% level at the bottom.
- In a bullish market, the reverse is true.
Example of Trading with Fibonacci Levels
- Uptrend Retracement:
Suppose the market retraces to the 38.2% Fibonacci level during an uptrend:
- Entry: Place a BUY position at this level.
- Stop Loss: Below the swing low or the 50% Fibonacci level.
- Take Profit: Near the next high or a resistance level.
- Key Levels to Watch:
- The 50% Fibonacci level often acts as a common retracement point.
- The 61.8% level is highly favored by traders for its significant pullbacks.
- The 78.6% level offers strong reversal opportunities but is frequently overlooked.
Chart Example
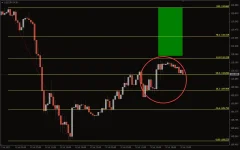
In the chart example of USD/JPY on the M30 timeframe, the price retraced beyond the 38.2% and 50% levels, eventually pulling back at the 61.8% level. After the pullback, it resumed its bullish trend, briefly revisiting the 38.2% level before continuing upward.Trade Example:
- Downtrend Entry: Enter a SELL position with a stop loss above the recent swing high.
- Exit: Consider exiting at the 78.6% level, the 100% Fibonacci level, or the next support zone.
- For further precision, Fibonacci expansion can also be used to determine take-profit levels.
Conclusion
The Auto Fibonacci Retracement indicator is a user-friendly tool that simplifies the process of plotting Fibonacci levels. While the indicator does not generate specific BUY or SELL signals, it provides reliable retracement levels that traders can use to plan their entries and exits.To maximize its effectiveness, it is recommended to combine the Auto Fibonacci Retracement indicator with other technical tools and trading strategies to achieve confluence and improve decision-making.


