- Joined
- Nov 3, 2024
- Messages
- 109
- Reaction score
- 1
- Points
- 16
Auto Fibo Indicator

The Auto Fibo Indicator for MetaTrader 5 is a tool designed to automatically plot Fibonacci retracement levels on the price chart, saving traders the time and effort of manually identifying key highs and lows. This tool works across all timeframes and currency pairs, making it a versatile addition to any trader's toolkit.
What is Fibonacci Retracement?
The Fibonacci retracement is based on a mathematical sequence (0, 1, 1, 2, 3, 5, 8, 13, etc.), and when you divide any number in the sequence by the next number, you get Fibonacci ratios that are commonly used in technical analysis. These ratios are represented as horizontal lines that indicate potential support and resistance levels during a price retracement.Common Fibonacci retracement levels include:
- 23.6%
- 38.2%
- 50%
- 61.8%
- 78.6%
How Does the Auto Fibo Indicator Work?
The Auto Fibo Indicator automatically detects the high and low points of a price movement, plotting Fibonacci retracement levels between 0% and 100% on the chart. It works as follows:- If the market is in a bearish trend, the 0% level is placed at the top, and the 100% level is at the bottom.
- If the market is in a bullish trend, the 0% level is placed at the bottom, and the 100% level is at the top.
How to Trade with the Auto Fibo Indicator
- Pullback Trading (In an Uptrend or Downtrend):
- In an Uptrend: If the price retraces up to a Fibonacci level, such as 38.2%, traders may enter a BUY position when the price pulls back. Stop-loss can be set below the recent swing low or below the 50% Fibonacci level. Profit targets can be set at the next resistance level or a higher Fibonacci level.
- In a Downtrend: Traders may place a SELL position after the price retraces to key Fibonacci levels like 38.2% or 50%. The stop-loss can be placed above the recent swing high, and the exit point can be set at the 23.6% level or 0% level, coinciding with support zones.
- Key Fibonacci Levels for Entry and Exit:
- Traders often use the 61.8% Fibonacci level as a significant reversal point. This level is closely watched due to its historical reliability.
- The 78.6% Fibonacci level can also be used as a reversal point but is often overlooked.
- Fibonacci Expansion can also be used to forecast potential take-profit levels beyond the 100% Fibonacci level.
Chart Example:
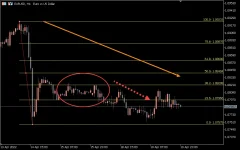
The Auto Fibo Indicator on a USD/EUR 1-hour chart shows how price retraces past the 23.6% and 38.2% Fibonacci levels. The price then pulls back to the 38.2% level before resuming a bearish trend.In this case, traders can:
- Enter a SELL position after the price reaches the 38.2% retracement level, with the stop-loss above the recent swing high.
- Set the take-profit at the 23.6% Fibonacci level or 0%, coinciding with the support zone.


