- Joined
- Nov 3, 2024
- Messages
- 109
- Reaction score
- 1
- Points
- 18
ADR Indicator for MT4

The ADR (Average Daily Range) Indicator for MT4 is a practical tool that helps traders estimate the market's daily movement range. By analyzing the market's historical volatility using ATR (Average True Range), it calculates the expected trading range and marks key levels that often act as support or resistance.
Features of the ADR Indicator
- Expected Market Range:
- Displays the current day's range and the average daily range (ADR) of a currency pair.
- Useful for identifying potential price extremes for intraday trading.
- Key Levels Displayed:
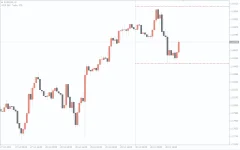
- Plots upper and lower ADR levels on the chart as dotted lines.
- These levels indicate the boundaries of the expected price movement for the day.
- Customizable Settings:
- The indicator's ADR calculation is based on the ATR period, which can be adjusted to suit specific trading strategies.
- Higher ATR periods provide smoother, more reliable ranges, while shorter periods are more sensitive to recent price movements.
- Volatility Analysis:
- Highlights changes in momentum and volume near ADR levels, signaling potential trend reversals or breakouts.
- Beginner and Expert Friendly:
- New traders: Use ADR levels as support and resistance to guide entry/exit points.
- Experienced traders: Combine ADR with other systems and strategies for more precise setups.
- Free to Download:
- Available for MT4 without cost and easy to install.
How to Use the ADR Indicator in Trading
1. Identifying Support and Resistance
- Lower ADR Level:
- Acts as support. When the price approaches this level, look for buying opportunities.
- Upper ADR Level:
- Acts as resistance. When the price nears this level, look for selling opportunities.
2. Breakout Trading Strategy
- When price breaks above the upper ADR level:
- Indicates a strong bullish momentum and potential continuation of the trend.
- Enter a buy trade after confirming the breakout with other indicators (e.g., RSI, MACD).
- When price breaks below the lower ADR level:
- Signals strong bearish momentum.
- Enter a sell trade after confirmation.
3. Reversal Trading Strategy
- Buy Setup:
- When the price touches or moves slightly below the lower ADR level, watch for reversal signals like bullish candlestick patterns.
- Enter a buy trade with a stop-loss below the recent swing low.
- Take profit at the upper ADR level.
- Sell Setup:
- When the price touches or moves slightly above the upper ADR level, look for bearish reversal patterns.
- Enter a sell trade with a stop-loss above the recent swing high.
- Take profit at the lower ADR level.
4. Combining ADR with Other Indicators
- Use alongside technical indicators such as:
- RSI: To confirm overbought or oversold conditions.
- Stochastic Oscillator: For momentum-based entry signals.
- Candlestick Patterns: For additional confirmation of reversals.
5. Intraday Support and Resistance
- In lower timeframes (e.g., M15, H1), ADR levels act as intraday support and resistance.
- Monitor price action at these levels to identify whether a reversal or breakout is more likely.
Example: EUR/USD H1 Trading Setup
- Observation:
- The ADR levels are plotted on the chart. The current day’s range is displayed at the top-left corner.
- Reversal Trade:
- The price reaches the lower ADR level and forms a bullish engulfing pattern.
- Enter a buy trade.
- Place a stop-loss slightly below the previous swing low.
- Set the take-profit at the upper ADR level.
- Breakout Trade:
- The price breaks above the upper ADR level with strong volume.
- Enter a buy trade on confirmation of the breakout.
- Use a trailing stop to capture additional profit as the trend continues.
Advantages of the ADR Indicator
- Precision in Market Range Analysis:
- Clearly defines the daily movement boundaries, reducing uncertainty in trade placement.
- Versatility:
- Suitable for multiple strategies, including breakout, reversal, and range-bound trading.
- Enhanced Decision-Making:
- Acts as a guide for setting realistic profit targets and stop-loss levels.
- Beginner-Friendly:
- Simple visualization helps new traders quickly grasp support and resistance concepts.
- Intraday and Swing Applications:
- Effective on both short and long timeframes, making it valuable for day traders and position traders.
Limitations
- Not a Standalone Tool:
- ADR should be used in conjunction with other indicators or price action for higher accuracy.
- Effectiveness Varies Across Pairs:
- Currency pairs with unusual volatility patterns may require adjustments to the ATR settings.
- Lagging Nature:
- As the ADR is based on historical ATR data, it may not capture sudden market shifts or news-driven volatility.
Conclusion
The ADR Indicator for MT4 is a valuable tool for traders aiming to understand daily price movement ranges. Its ability to define upper and lower boundaries simplifies the identification of support, resistance, and potential breakout or reversal zones.To maximize the indicator’s utility:
- Combine ADR levels with price action analysis or other indicators for confirmation.
- Test and optimize ATR settings for different currency pairs to align with specific trading strategies.


