- Joined
- Nov 3, 2024
- Messages
- 109
- Reaction score
- 1
- Points
- 16
1-2-3 Pattern Indicator for MT4

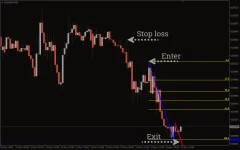
The 1-2-3 Pattern Indicator for MT4 is designed to identify price action patterns at the end of a trend. This indicator combines a non-repainting zig-zag pattern with Fibonacci levels to determine support and resistance and pinpoint potential entry and exit points for trades.
The pattern gets its name from its structure, which identifies three key points:
- High/Low – the extreme price level of the trend.
- Entry – the point where traders should consider entering the market.
- Fib – Fibonacci retracement levels used for support and resistance.
Key Features of the 1-2-3 Pattern Indicator
- Non-Repainting Zig-Zag Pattern:
- The zig-zag lines provide a clear visual representation of price action trends.
- These lines help identify the beginning, end, and potential reversal points of a trend.
- Fibonacci Levels:
- The indicator highlights five Fibonacci levels, which act as support and resistance zones.
- These levels guide traders in setting stop-loss and take-profit levels.
- Multi-Timeframe Use:
- While the indicator can be applied to any timeframe, it works best on shorter timeframes like 5-minute to 30-minute charts.
- Trend Identification:
- Green lines indicate an uptrend (buy signals).
- Blue lines indicate a downtrend (sell signals).
How to Trade Using the 1-2-3 Pattern Indicator
Buy Setup
- Confirm that the indicator suggests an uptrend (green zig-zag line appears).
- Wait for the uptrend to fully develop.
- Enter the trade at the starting point of the green line.
- Place a stop-loss below the most recent low (support level).
- Exitthe trade:
- When the price dips below the green line.
- Or when the trend reverses and the indicator turns red.
Sell Setup
- Confirm that the indicator suggests a downtrend (blue zig-zag line appears).
- Wait for the downtrend to fully develop.
- Enter the trade at the starting point of the blue line.
- Place a stop-loss above the most recent high (resistance level).
- Exitthe trade:
- When the price moves above the blue line.
- Or when the trend reverses and the indicator turns green.
Conclusion
The 1-2-3 Pattern Indicator is a versatile tool for traders focused on price action strategies. Its combination of non-repainting zig-zag lines and Fibonacci retracement levels offers reliable support for identifying entry and exit points. Additionally, the indicator's ability to highlight support and resistance levels makes it a valuable tool for managing risk and optimizing trading performance.This indicator is suitable for traders of all experience levels and can be particularly effective in short-term trading scenarios on lower timeframes.


